Hello,
I’m experiencing a problem with the Cumulative Flow Diagram for my project. It incorrectly displays hundreds of resolved tickets in the ‘Testing’ column on my board, even though they weren’t there at the calculation time.
Here is my board configuration:
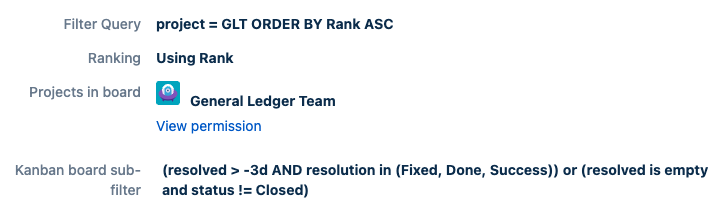
Here is the columns mapping:
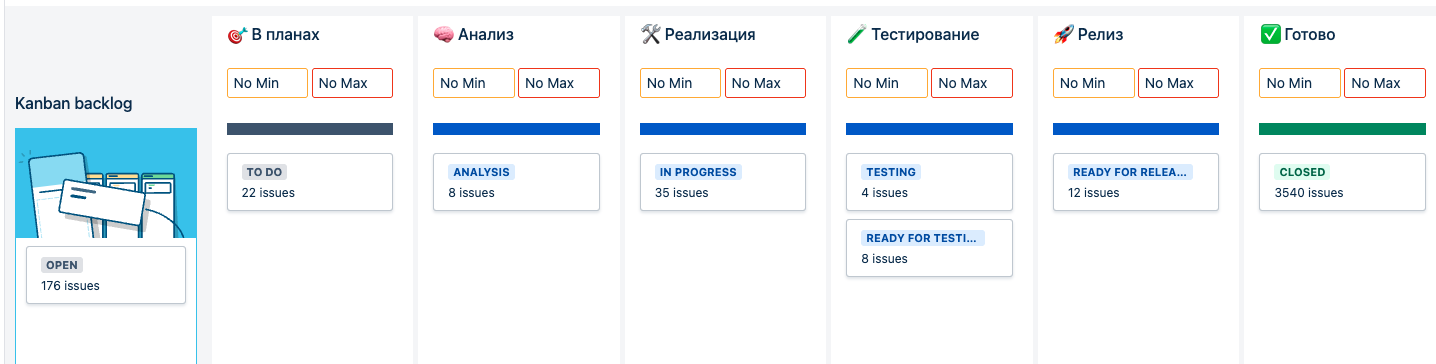
Here is its current appearance:
![]()
Here is what the CFD displays (with no filters applied and all swimlanes present):
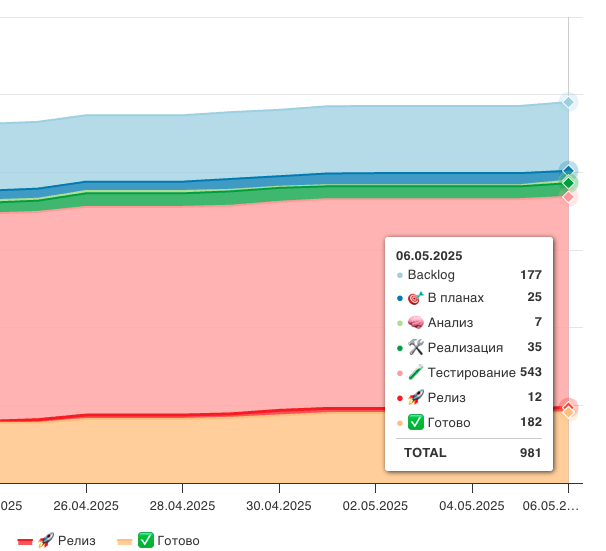
I expect to see only 12 issues in the ‘Testing’ column, but it currently shows 543. I consulted the documentation at Cumulative Flow Diagram (CFD) Report | Jira Metrics Plugin, but it doesn’t explain the calculation algorithm.
This issue began after I added an ‘Analysis’ stage to my process. When I modified the workflow, the existing reports stopped functioning correctly as they didn’t account for the new stage, so I had to reset the configuration and re-import the board. The ‘Analysis’ column appeared as expected, but the ‘Testing’ column became corrupted. This problem seems to affect only the CFD, as other reports are working fine.
Thanks,
Pavel