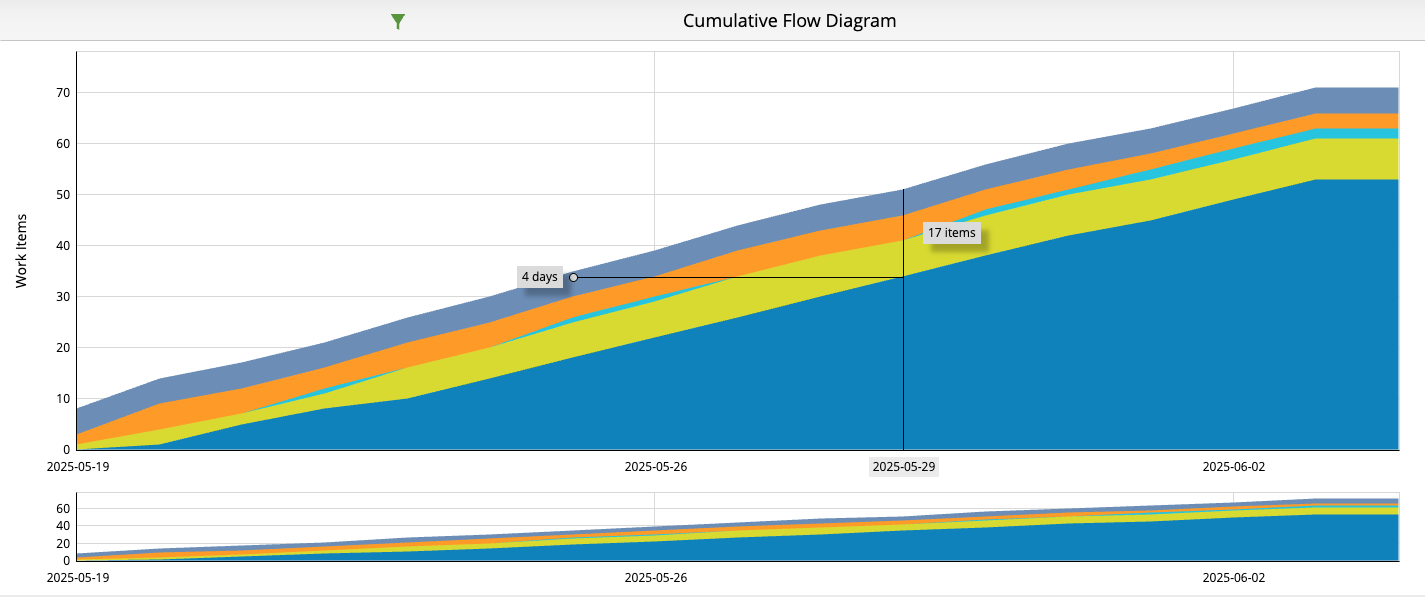
I suggest adding a tooltip for cycle time in the CFD. When the user hovers over the diagram, the cycle time between the first active column and the last active column is displayed. This way, it is easier to get a feeling for changes in flow rate. Further enhancements are possible, but this is the one I cannot find a workaround for.
When the patterns in the flow charts are not wildly obvious, it is hard to see the changes in the flow rate. These small changes are the most useful ones to find (and fix) early. When the pattern is very obvious visually, the team usually knows already (fast growning backlog etc). But if the speed increases or not, is not easy to determine with this chart.